
Boston meets Seattle in Financial Health Bowl
Published 28th Jan 2015When it comes to predictions for the biggest football game of the year, there is no shortage of prognosticators, and prognostications. I even saw a “prop” bet on the type of outfit Katy Perry was going to wear for the Halftime show.
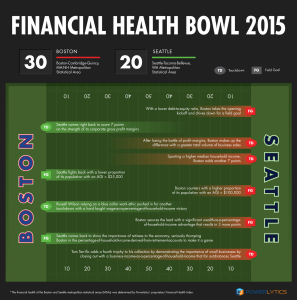
“That’s why they play the game” has been the only consistently accurate answer to the question, “Who is going to win the Big Game.” But, if pundits can predict the outcome based upon the arrangements of the constellations or the subtle movements of an octopus, we thought that we might be able to offer a more reasoned and plausible analysis. So we conducted a head-to-head competition between the two cities represented in the Big Game to see who would win based upon “a battle” between the financial health of their respective metropolitan statistical areas (MSA).
Lucky for us, we developed the most accurate set of U.S. economic data and data analysis tools that generate valuable insights from a range of economic variables. With a bit of number crunching, we were able to calculate precise values tied to indicators of financial health for both the Boston and Seattle MSAs. We honed in on key gauges of health for both businesses and consumers, the metrics we evaluated by MSA included:
– Corporate debt-to-equity
– Corporate gross profit margin
– Total business sales
– Median household income
– Total percent of filers with an AGI below $25,000
– Total percent of files with an AGI above $100,000
– Wages as a percent of household income
– Wealth as a percent of household income
– Retirement as a percent of household income
– Business income as a percent of household income
Based on our analysis of financial health, we found that Boston beat out Seattle 30 to 20.
While you might dispute the points assigned to each category (the more valuable the indicator, the more points it was assigned), there is no disputing the information behind the comparison, as it draws from a database that houses publicly-available information on all 144 million households and 27 million businesses that comprise the American economy.
Typically used to help companies like banks make more informed lending decisions and insurance companies fine tune their growth opportunities, our team found it fun to join in with the many other Big Game prognosticators who are using all forms and sources of data and analytics to try to predict the outcome and winner. We figured providing a completely new perspective, one based on the financial health of these two metropolitan areas as we exit the Great Recession, would be intriguing for ourselves and our customers. While we can’t for sure state what the relationship is between the financial health of an MSA and the chances that its hometown team will win any one football game, we’ll soon find out which team ends up on top.
Read next

Published 22nd Jan 2015
ArchivedVeracity – The Challenge Bankers Face with Big Data
In a recent survey from Aite Group three quarters of North American bankers said they are dissatisfied with analytics technology. In particular, 76 percent of North American bankers were particularly dissatisfied with...
Read Article