•
Contact Us•
Login
The Powerlytics Recession Impact Score and Recession Short-Term and Long-Term Recovery Scores are three new tools that can help your business better understand which customers and which areas within a business may be most impacted by another recession or economic shock.
These tools were developed utilizing the Powerlytics Data Platform that includes over 3,000 individual data points for over 200 million adults and the financial statements of over 30 million for profit companies developed from their respective IRS-filed tax returns. Each Score was developed by looking at the 2008 recession and its impact on every residential nine-digit ZIP Code (ZIP+4). Each ZIP+4 has 3-4 households on average and with approximately 40 million in the U.S., it is a very granular measure.
The Powerlytics Recession Impact Score is developed by looking at the pre-recession financial strength of each ZIP+4 across the U.S. and then analyzing the change that occurred during the recession and measuring the impact of that change.
The Powerlytics Short-Term Recovery Score measures the degree of improvement in the first full year after the Recession and the Long-Term Recovery Score measures the recovery through 2019.
The Recession Impact Score can assist with understanding which customers may be impacted the hardest by another recession and may require additional assistance or support. It also helps identify where there may be additional risk that should be accounted for within a business. The Recession Recovery Scores can provide additional insight into what areas may be better situated for a quicker recovery versus a prolonged recovery period.
Powerlytics’ clients have discovered that these scores have a very high correlation with loan portfolio charges-offs.
Lower Recession Scores indicate areas that can withstand an economic shock and recover from better than those areas with higher scores.
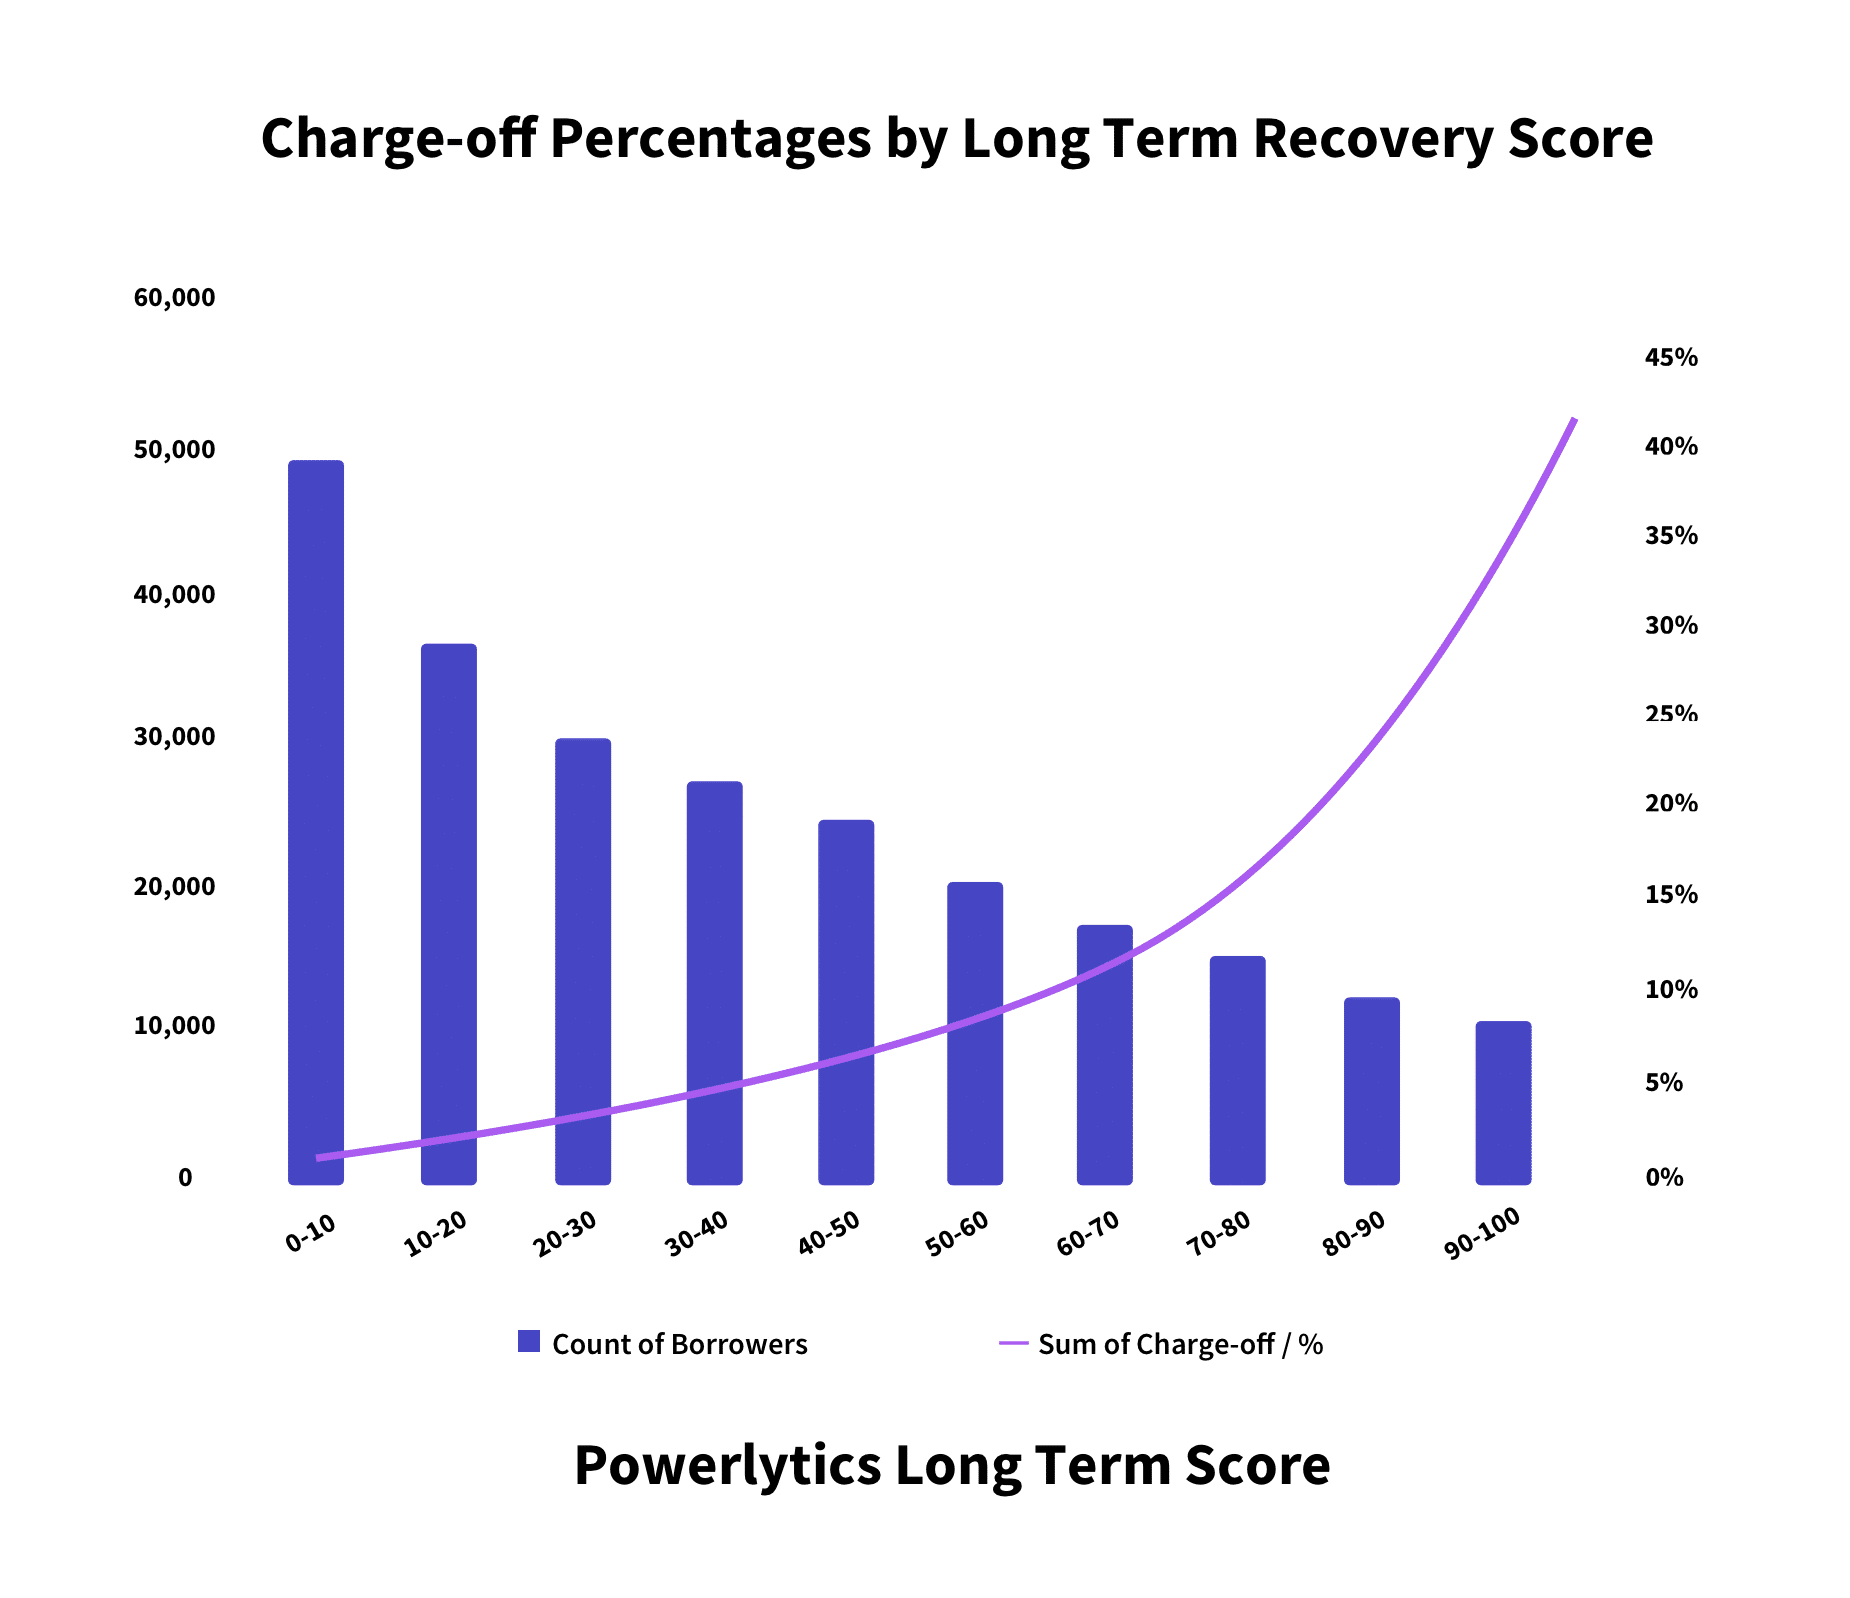
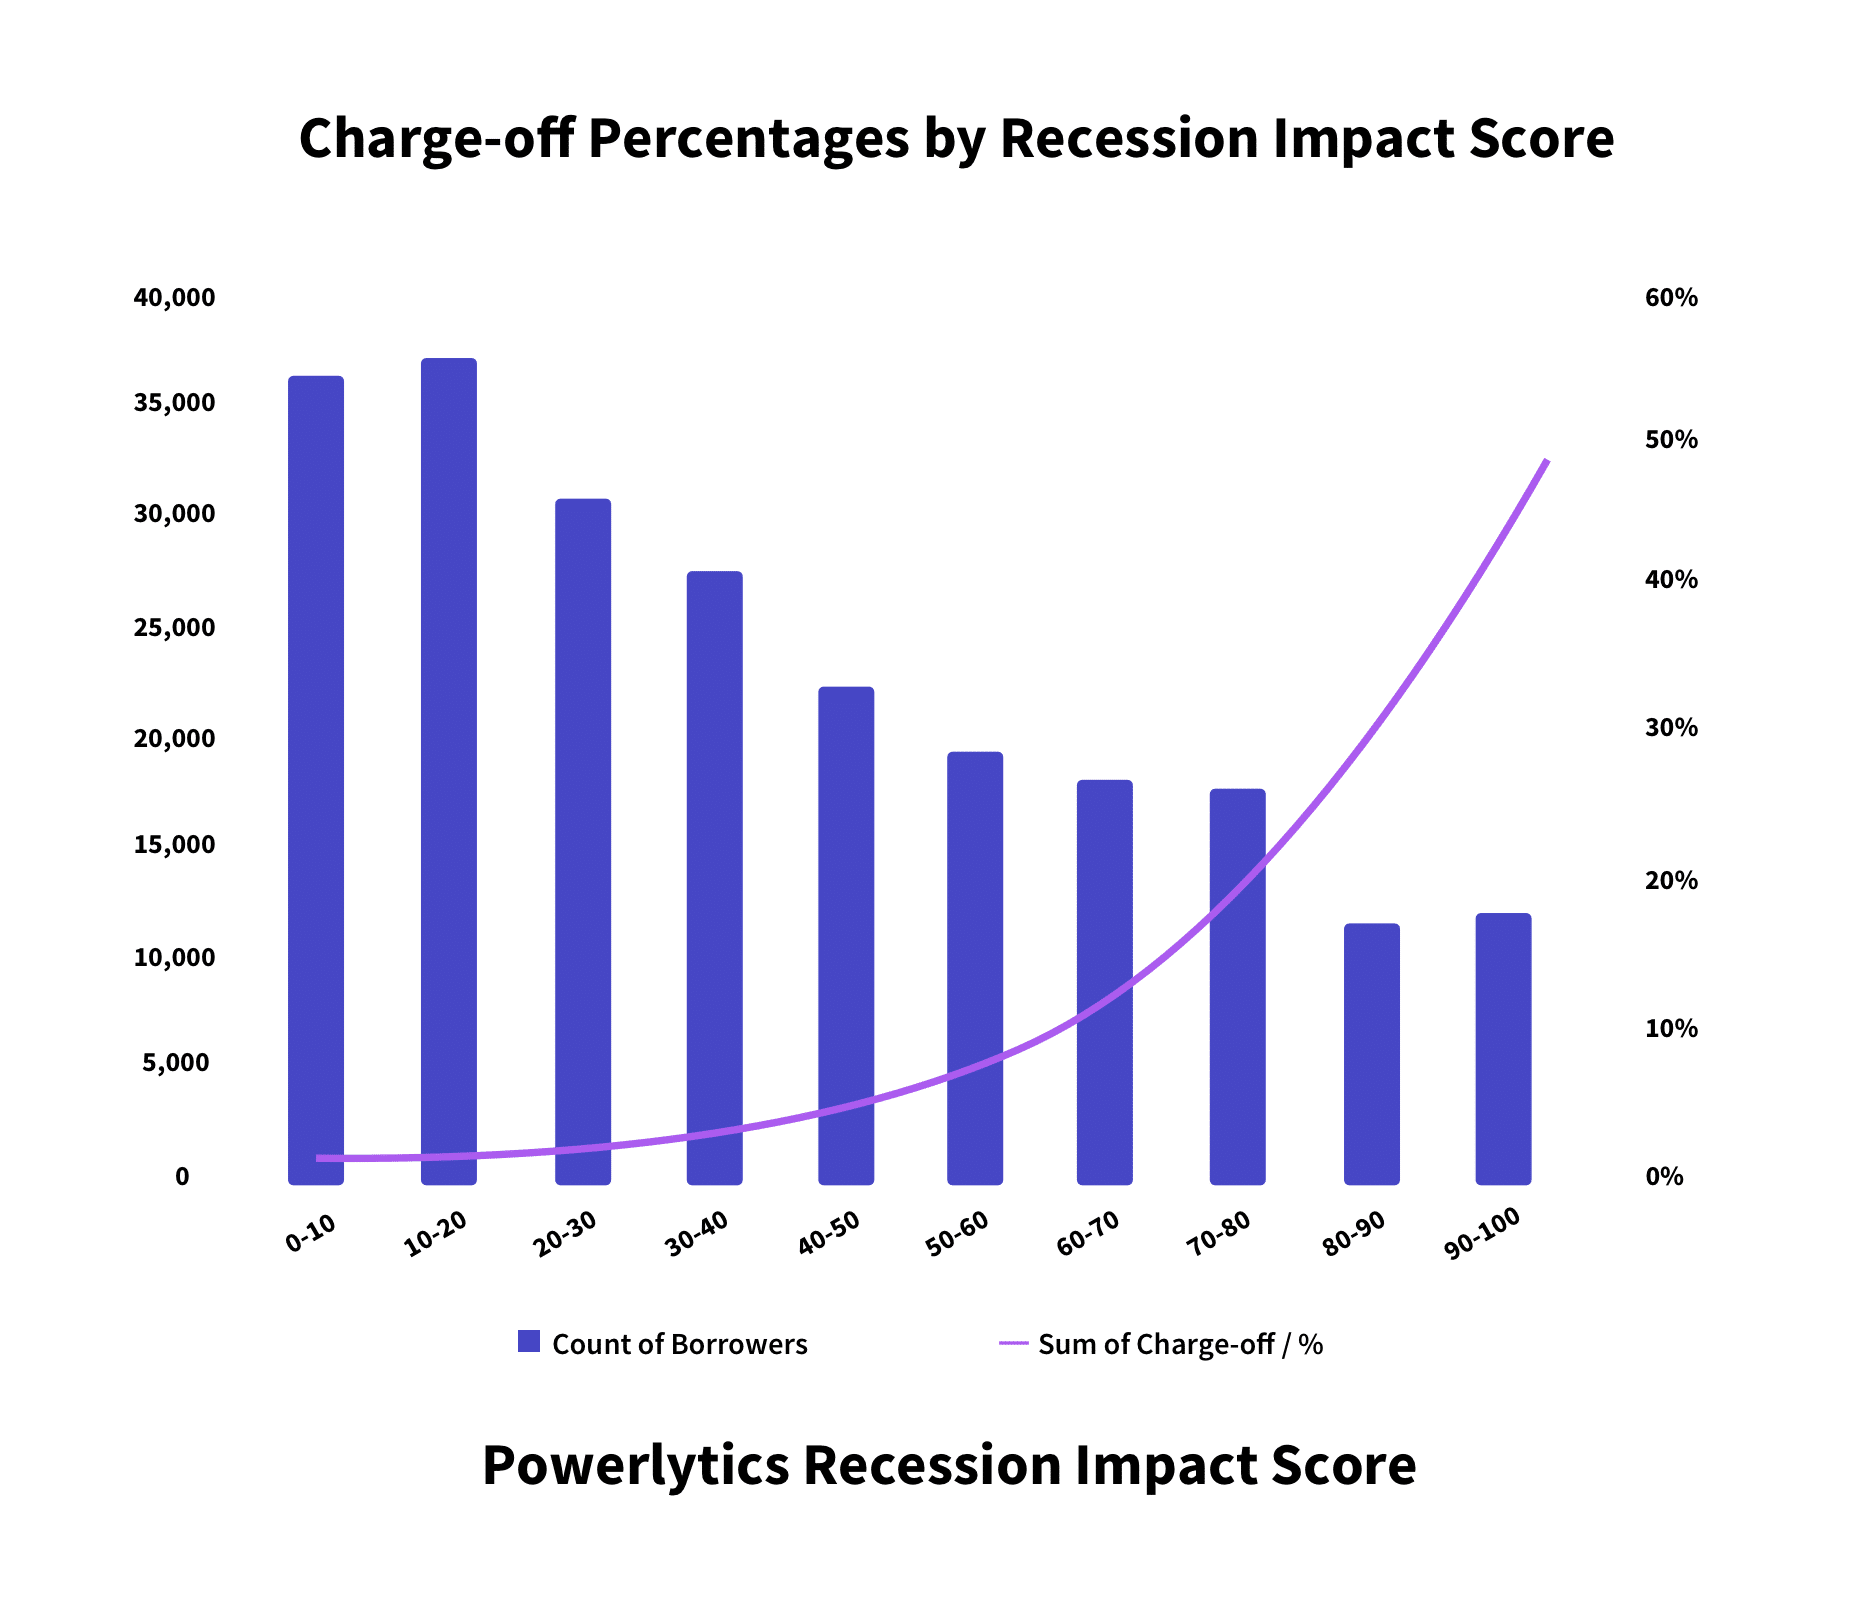
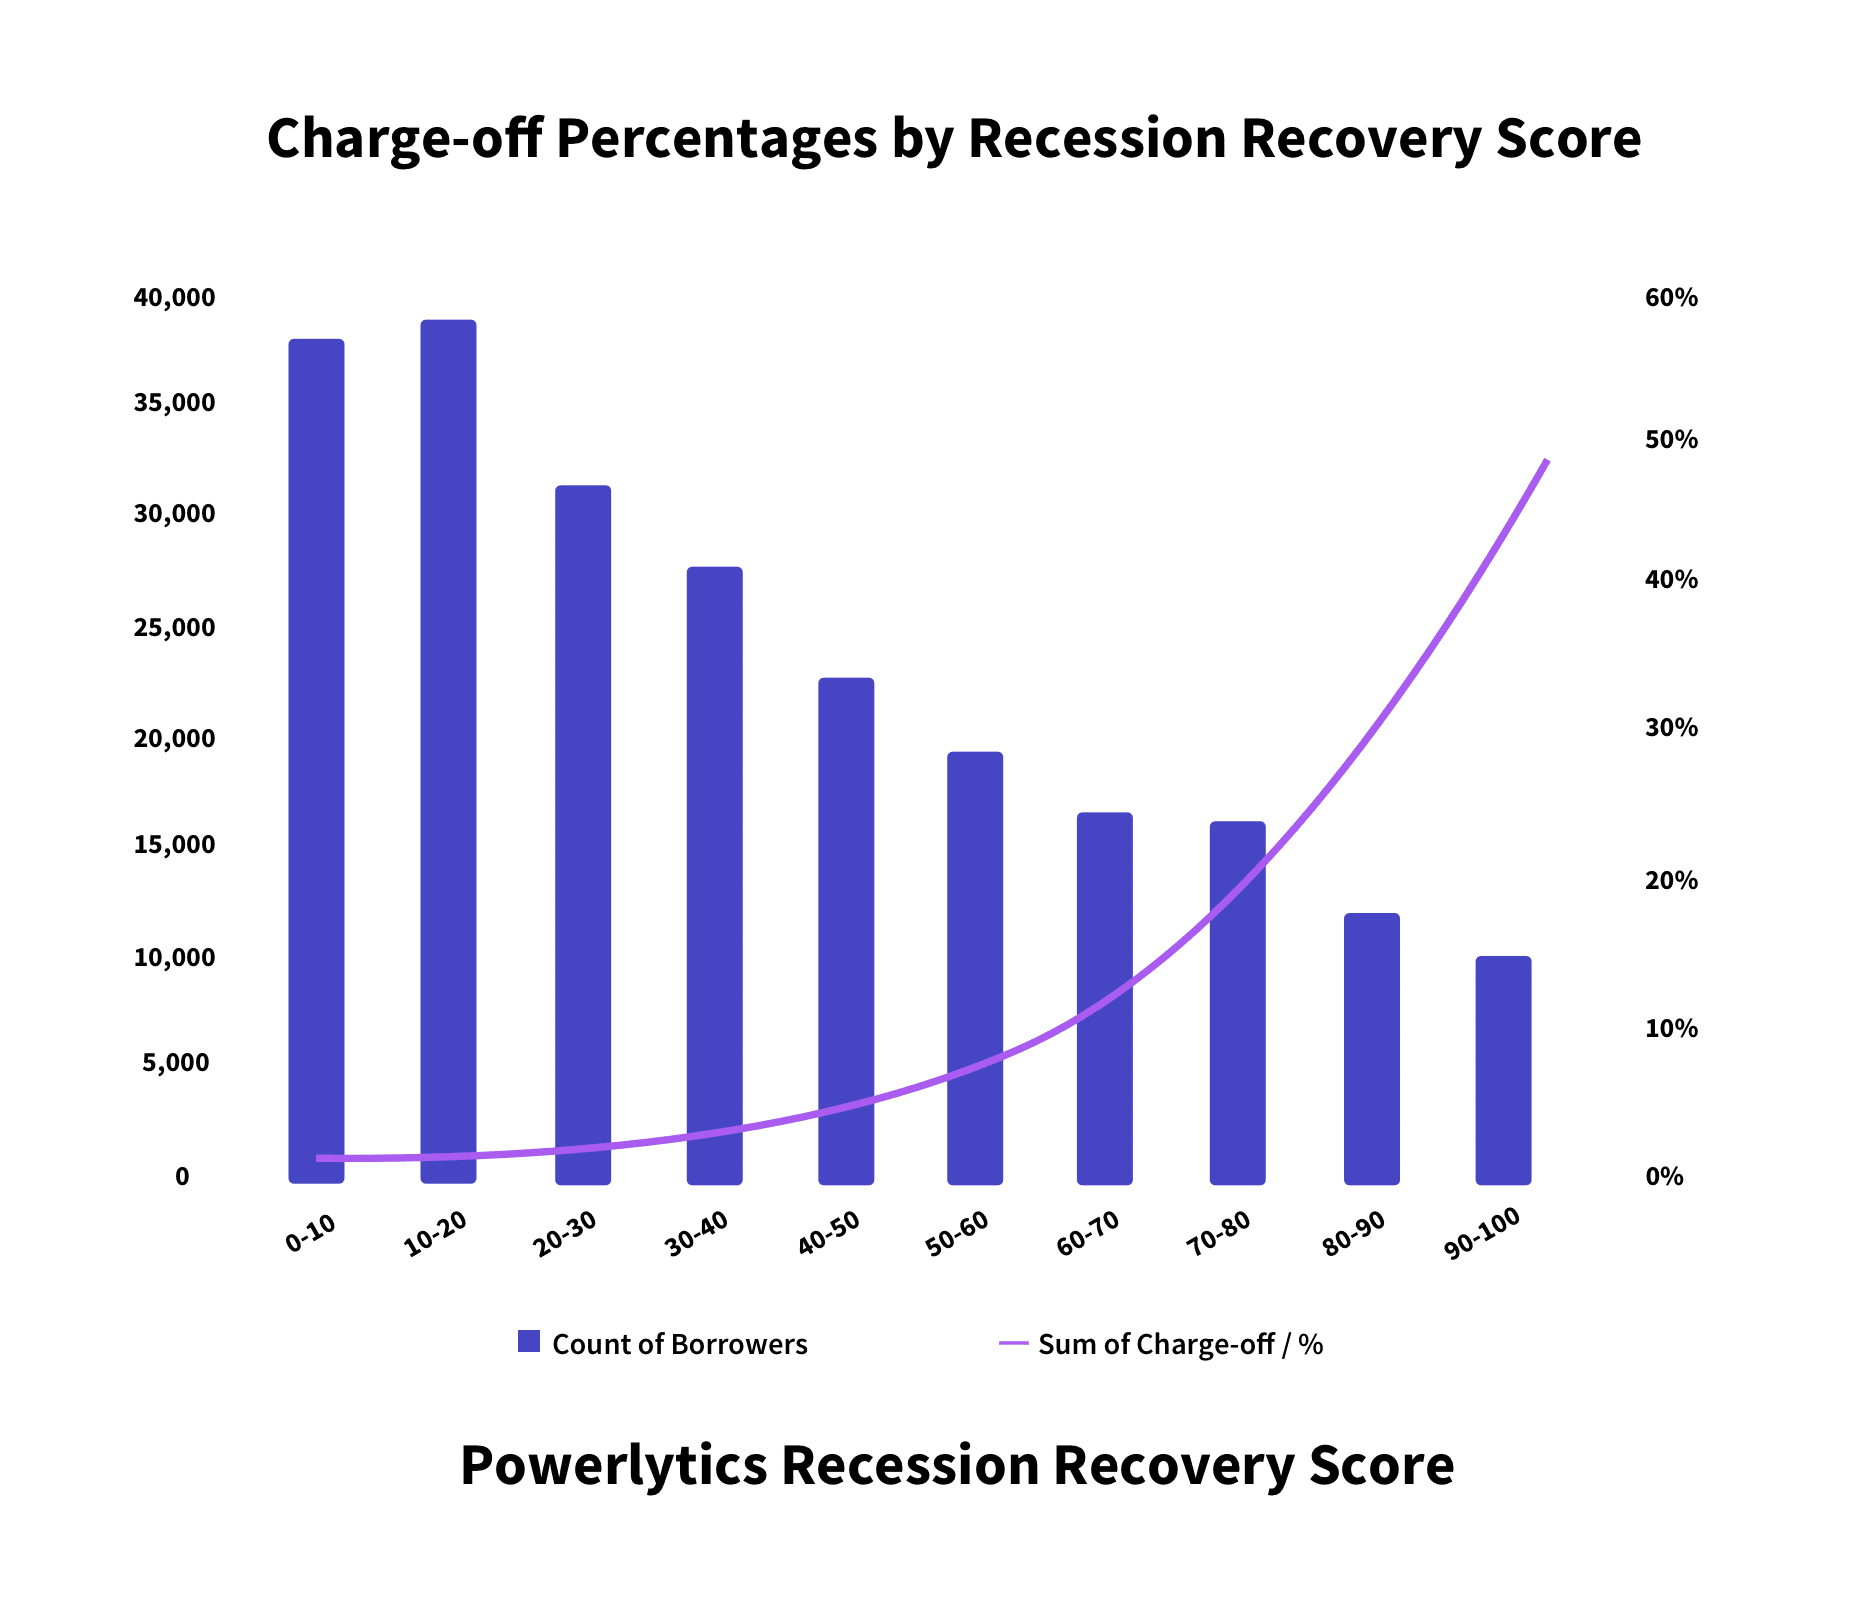
As the three charts below illustrate, while borrowers in the higher scoring areas were the smaller population for this lender, they had a significantly higher charge-off percentage.
Illustrates that that the loan charge-off percentage for the borrowers that had Recession Impact Scores in the areas that fell in the top 10% of the most severely impacted areas in the last recession had a charge-off rate of more than 2,700 times higher (48.75% vs. 1.76%) than those that fell in the best 10%.
Illustrates that that the loan charge-off percentage for the borrowers that had Short-Term Recession Recovery Scores in the areas that fell in the top 10% of the most severely impacted areas in the last recession had a charge-off rate more 2,700% higher (48.8% vs. 1.78%) than those that fell in the best 10%.
Illustrates that that the loan charge-off percentage for the borrowers that had Long-Term Recession Recovery Scores in the areas that fell in the top 10% of the most severely impacted areas in the last recession had a charge-off rate more 1,700% higher (40.47% vs. 2.28%) than those that fell in the best 10%.